
SQL Server performance tuning can feel daunting, but one of the most effective approaches is to focus on wait statistics. Every time a SQL Server query has to pause (waiting for a resource or some condition), SQL Server records a wait type. By analysing these wait stats, DBAs, developers, and system administrators can pinpoint bottlenecks more easily than by poring over old-school metrics like buffer cache hit ratios or disk queue length. In this post, we’ll explain how to assess SQL Server performance issues by interpreting wait statistics and other related data. We’ll cover practical methods to gather this information – from built-in dynamic management views (DMVs) to community tools like Brent Ozar’s First Responder Kit and commercial solutions like Redgate SQL Monitor – and discuss how to interpret common wait types such as CXPACKET, PAGEIOLATCH, ASYNC_NETWORK_IO, and SOS_SCHEDULER_YIELD. We’ll also highlight essential SQL Server configuration tips (e.g. MAXDOP, parallelism, ad hoc workloads, indexing) and show how to use execution plans to diagnose slow queries.
Understanding Wait Statistics and Why They Matter
When a SQL Server thread is forced to wait on some condition, it notes the reason as a wait type. Think of wait stats as a log of why queries were delayed – whether they were waiting for I/O to complete, for a lock to be released, for a CPU to become available, etc. These waits are accumulated in the DMV sys.dm_os_wait_stats, which “returns information about all the waits encountered by threads” and can be used to diagnose performance issues at the server or query level (learn.microsoft.com). In other words, by examining which wait types have the most wait time, we can infer the primary bottlenecks on the server (CPU, disk, network, etc.) at a given time.
Not all waits indicate a problem – some background waits are normal – so we focus on the top waits contributing the most to delays. For example, if most wait time is recorded under a disk I/O wait type, the server is likely I/O-bound (queries are waiting on disk reads/writes). If the top wait is a CPU-related wait, the server could be CPU-bound, and so on. Microsoft’s guidance for troubleshooting slow queries suggests first determining if a query is spending most of its time running (CPU) or waiting (external bottleneck) (learn.microsoft.com | learn.microsoft.com). Generally, if a query’s total elapsed time is much higher than its CPU time, it means it spent a lot of time waiting on some bottleneck (I/O, locks, etc.). On the other hand, if CPU time is close to elapsed time, it was mostly CPU-bound (we’ll discuss how to interpret specific wait types below). By categorising waits, you can direct your tuning effort to the right area (e.g. add an index to reduce I/O waits, or fix an application issue causing network waits).
Gathering Performance Data: DMVs, Community Scripts, and Monitoring Tools
There are multiple ways to collect and analyse wait stats and other performance data in SQL Server. We’ll look at three approaches: using built-in DMVs with T-SQL, using Brent Ozar’s First Responder Kit scripts, and using Redgate SQL Monitor. Each approach helps you identify where the bottlenecks are, so you can then dig into the cause.
Using Built-in DMVs and T-SQL Queries
SQL Server exposes a wealth of information through Dynamic Management Views (DMVs). To assess overall waits on your instance since the last restart, you can query sys.dm_os_wait_stats. For example, the query below retrieves the top waits (ignoring some benign system waits) by total wait time:
SELECT TOP 10
    wait_type,
    SUM(wait_time_ms) AS total_wait_ms,
    SUM(waiting_tasks_count) AS wait_count,
    100.0 * SUM(wait_time_ms) / SUM(SUM(wait_time_ms)) OVER() AS percentage_of_total_waits
FROM sys.dm_os_wait_stats
WHERE wait_type NOT IN (
    'SLEEP_TASK', 'BROKER_TASK_STOP', 'BROKER_EVENTHANDLER',
    'XE_TIMER_EVENT', 'BROKER_RECEIVE_WAITFOR', 'SQLTRACE_BUFFER_FLUSH'
    -- (list of waits that are typically idle or background)
)
GROUP BY wait_type
ORDER BY total_wait_ms DESC;
This will list the wait types that accumulated the most wait time. You can then focus on those top wait types to interpret what they mean (see Interpreting Common Wait Types below). Microsoft’s documentation provides definitions for many wait types – for instance, a PAGEIOLATCH_SH wait “occurs when a task is waiting on a latch for a buffer that is in an I/O request (shared mode, typically reading a page from disk). Long waits might indicate problems with the disk subsystem.” (learn.microsoft.com). By running DMV queries, you get a quick snapshot of the server’s pain points.
Besides the cumulative waits, you might want to see what queries are waiting right now. For current activity, DMVs like sys.dm_os_waiting_tasks and sys.dm_exec_requests are useful. For example, you can join these to find which session is waiting on what, and if it’s being blocked by another session. A community tool, sp_WhoIsActive, can simplify this – it’s a free stored procedure that lists active queries and their waits (helpful to catch things like queries stuck on ASYNC_NETWORK_IO, etc.). If you prefer T-SQL, an equivalent is joining sys.dm_exec_requests (to get the executing query text and session) with sys.dm_os_waiting_tasks (to get the wait type). This can show, for example, that session 52 is waiting on a lock (LCK_M_X) held by session 53, or that a query is waiting on ASYNC_NETWORK_IO. In summary, DMVs let you both see broad trends (with dm_os_wait_stats) and instantaneous wait info for active queries.
Using Brent Ozar’s First Responder Kit
The First Responder Kit is a set of SQL scripts (available on GitHub) by Brent Ozar and collaborators that automate many diagnostic checks. It includes tools like sp_BlitzFirst for immediate performance checks, sp_BlitzCache to analyse the plan cache for problematic queries, sp_BlitzIndex for indexing analysis, and more. These are widely used by DBAs because they quickly surface common problems and are regularly updated by the community.
To use it, you’ll need to install the scripts (they’re just stored procedures). For example, running EXEC sp_BlitzFirst @Seconds = 0; will immediately retrieve the accumulated wait stats (and other metrics) since startup, without taking an active sample (brentozar.com). By default, running sp_BlitzFirst with no parameters actually samples a 5-second interval of activity, which can be useful to see right now waits (you can do EXEC sp_BlitzFirst @Seconds=5 for a 5-second sample). The output of sp_BlitzFirst will highlight the top wait types on the server in that interval or since startup. It might show something like “Top Wait: CXPACKET” or “Top Wait: PAGEIOLATCH_SH” along with percentages. This immediately tells you the biggest bottleneck category to investigate.
Brent Ozar’s toolkit also helps in the next steps of investigation. For instance, if you have a high CXPACKET wait (related to parallelism, explained later), Brent’s advice is to run sp_BlitzCache @SortOrder = 'reads'; to find the queries doing the most reads (brentozar.com) – these are often the ones going parallel and contributing to CXPACKET waits. If you have a lot of PAGEIOLATCH waits (indicating heavy disk reads), the same sp_BlitzCache @SortOrder = 'reads' helps find the queries doing massive I/O, and you’d look at their execution plans for missing index suggestions or inefficiencies. For blocking (lock waits), sp_BlitzIndex can warn about indexes that might be missing (causing long table scans) or overly aggressive indexes that might be causing excessive locking (brentozar.com | brentozar.com). In short, the First Responder Kit not only tells you what the waits are, but also provides scripts to dig into which queries or indexes are likely causing those waits, making it a powerful ally in performance tuning.
Using Redgate SQL Monitor
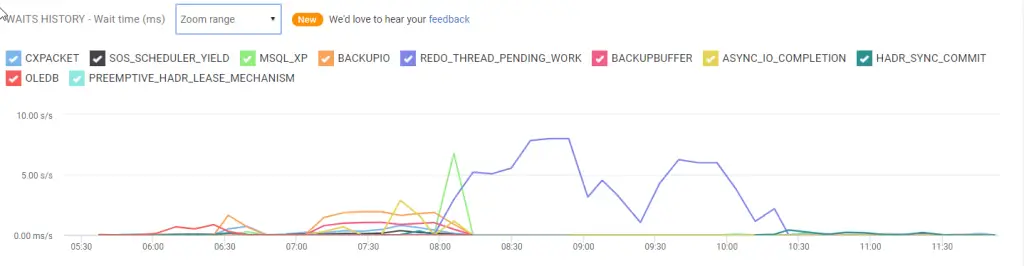
For a more visual and continuous monitoring approach, Redgate SQL Monitor is a popular tool that tracks SQL Server performance metrics over time, including wait stats. It has a dedicated Top Waits section that presents the data from sys.dm_os_wait_stats in a friendly format (documentation.red-gate.com | documentation.red-gate.com). For example, it shows a waits history graph charting the evolution of various wait types over time, and a Top waits table listing the most significant waits, their cumulative wait time, number of occurrences, and even the queries affected (documentation.red-gate.com | documentation.red-gate.com).
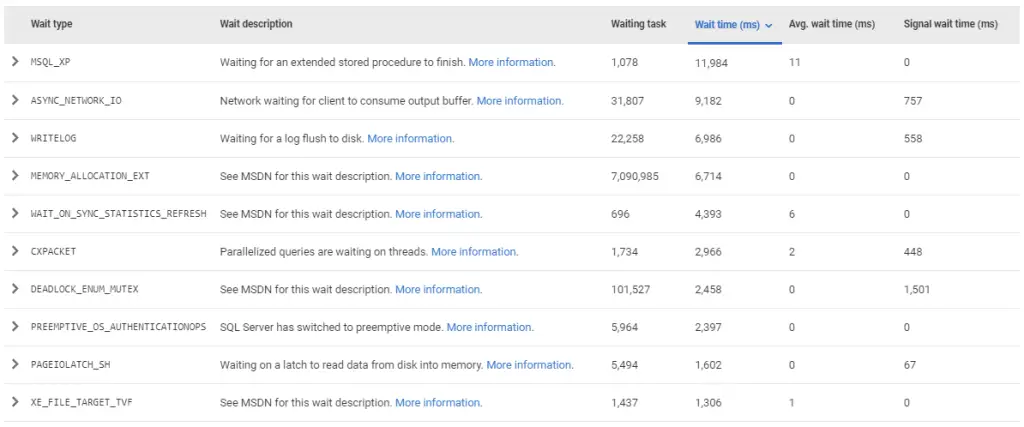
One neat feature of Redgate Monitor is that it provides built-in descriptions and troubleshooting advice for common wait types. In the Top Waits table, each wait type has a short description (for instance, “Network waiting for client to consume output buffer.” for ASYNC_NETWORK_IO, or “Waiting on a latch to read data from disk into memory.” for PAGEIOLATCH_SH) and a “More information” link (documentation.red-gate.com | documentation.red-gate.com). This is extremely helpful for users who might not remember what every wait type means – the tool itself tells you what a given wait generally implies. Under the hood, Redgate Monitor is still using the same DMVs (it periodically samples sys.dm_os_wait_stats), but it stores history so you can see trends (e.g. you had a spike of WRITELOG waits last night at 2 AM). It also correlates waits with specific queries on the instance overview, so you might notice that your top ASYNC_NETWORK_IO wait corresponds mostly to a particular stored procedure that returns tons of rows.
Another advantage of a monitoring tool like this is alerting: you can set up alerts if certain waits dominate for prolonged periods. Redgate’s documentation even provides a knowledge base of wait types with causes and investigation tips (documentation.red-gate.com) – essentially a library of performance tuning hints. While SQL Monitor is a paid product, many organisations already using it can leverage these features to shortcut the diagnosis of performance issues.
No matter which method you use, the goal is to obtain a clear picture of what resource each slow query is waiting on. Next, we’ll dive into interpreting some of the most common wait types you’re likely to see and how to address them.
Interpreting Common Wait Types (and How to Fix Them)
In this section, we’ll explain several common wait types – CXPACKET, PAGEIOLATCH, ASYNC_NETWORK_IO, and SOS_SCHEDULER_YIELD – and give guidance on what they mean and how to mitigate the bottlenecks they represent. Understanding these will cover a large portion of typical SQL Server performance problems. (Of course, many other wait types exist – e.g. locking waits like LCK_M_X for locks, WRITELOG for transaction log writes, etc. – but we’ll focus on the ones asked about.)
CXPACKET – Parallelism Waits
CXPACKET is historically one of the most misunderstood wait types. This wait occurs during parallel query execution. When a query runs with a parallel plan, SQL Server splits the work across multiple threads. If one thread finishes early (for example, it had fewer rows to process) it will wait for the other threads to catch up – this waiting time is accumulated as CXPACKET wait (documentation.red-gate.com). Essentially, CXPACKET is the coordination overhead of parallelism: it’s the time threads spend waiting on each other.
A high CXPACKET wait percentage indicates that a lot of query processing time on the server involves parallel queries. This isn’t always a bad thing – in a data warehouse or OLAP environment with large queries, some CXPACKET is expected (documentation.red-gate.com). But in an OLTP environment (many small transactions), excessive CXPACKET waits can hurt overall throughput (documentation.red-gate.com). The presence of CXPACKET as a top wait suggests either queries reading huge amounts of data (causing the optimizer to go parallel) or suboptimal parallelism settings at the server level (we’ll discuss MAXDOP shortly).
How to investigate and reduce CXPACKET waits: First, identify the queries causing parallelism. You can find recent expensive queries via the plan cache or Query Store and see if their execution plans have parallel operators. Using the First Responder Kit: run sp_BlitzCache @SortOrder = 'CPU' or 'reads' to find queries with high cost; those often go parallel. Look at their plans for the parallelism icon (two arrows on an operator indicate it ran in parallel – learn.microsoft.com). If one query is doing an expensive table scan or aggregation, that’s a likely culprit. Try to tune that query – for example, add an index or improve the WHERE clause so it reads fewer rows, which might make a parallel plan unnecessary or at least less extreme. Ensure statistics are up to date, because outdated stats can mislead the optimizer into using too many or too few threads (documentation.red-gate.com.)
Next, check your server’s parallelism configuration: Cost Threshold for Parallelism and Max Degree of Parallelism (MAXDOP). The default Cost Threshold is 5 (meaning any query estimated to have cost >5 may go parallel), which is often too low for modern servers. Many DBAs raise this to e.g. 50 or higher so that only genuinely heavy queries go parallel. MAXDOP controls how many CPU cores can be used per query. The default MAXDOP is 0 (no limit, i.e. use all cores), but Microsoft recommends capping it – typically 8 or less – to avoid excessive thread usage (documentation.red-gate.com). Microsoft’s official guidelines suggest keeping MAXDOP at or below 8 on a single NUMA system, or half the cores per NUMA node (max 16) on larger servers (support.microsoft.com). In practice, setting MAXDOP to 4 or 8 is common for OLTP workloads. By increasing Cost Threshold and adjusting MAXDOP, you can reduce unnecessary parallelism. Brent Ozar’s advice in tackling CXPACKET is: apply sensible parallelism settings, then focus on tuning the high-read queries that are going parallel (brentozar.com). This two-pronged approach (configure the engine and optimize the queries) usually handles CXPACKET waits: after that, you should see CXPACKET drop in your wait stats and overall query throughput improve.
PAGEIOLATCH – Disk I/O Waits
PAGEIOLATCH_ waits* (such as PAGEIOLATCH_SH, PAGEIOLATCH_EX, etc.) indicate waiting for data pages to be read from disk into memory. When SQL Server needs a page that’s not already in the buffer cache, it issues an I/O to load it, and any thread needing that page will wait with a PAGEIOLATCH wait (latch is an internal lock for the page structure). For example, PAGEIOLATCH_SH is a wait for a page read in Shared mode (meaning a select reading a page) (learn.microsoft.com). In plain terms, the server is waiting on slow storage or very large data reads.
Long PAGEIOLATCH waits often mean either I/O subsystem bottlenecks (the storage is slow or overloaded) or simply that queries are reading massive amounts of data from disk (possibly due to missing indexes or queries that aren’t selective). In fact, one expert notes that it “almost always happens due to large scans over big tables” and “almost never happens in queries that use indexes efficiently” (stackoverflow.com | stackoverflow.com). For example, if you run a SELECT with no useful index so it has to scan millions of rows, you’ll likely see PAGEIOLATCH waits as those pages stream in from disk.
How to investigate and reduce PAGEIOLATCH waits: The first step is to identify queries doing a lot of physical I/O. You can use sys.dm_exec_query_stats joined with sys.dm_exec_sql_text to find queries with high total logical reads (as a proxy for I/O) or check the “missing index” DMVs for any glaring missing index recommendations. The execution plan for a slow query will tell you if it’s doing table scans or index scans – and it might even have a green suggestion for an index. Creating a proper covering index can drastically reduce the amount of data read from disk, thus reducing PAGEIOLATCH waits. For instance, if you have a query SELECT * FROM Orders WHERE CustomerID = 123 ORDER BY OrderDate, but no index on CustomerID, SQL might scan the whole Orders table. Adding an index on (CustomerID, OrderDate) would allow it to seek directly to that customer’s orders and maybe even read in sorted order, eliminating the large scan (the Stack Overflow example demonstrates this principle –stackoverflow.com). Always evaluate if a missing index is truly helpful (and not duplicating an existing one), but missing index stats are a great starting point.
Apart from indexing, consider query tuning: does the query request more data than it actually needs? Maybe adding a WHERE clause or breaking a report into smaller chunks could reduce I/O. Also, watch out for inefficient data types (reading large blobs unnecessarily) or **SELECT *** when not all columns are needed.
If your workload is legitimately I/O-heavy (e.g. scanning a data warehouse fact table), you might be facing storage limitations. In that case, one fix is to add more memory (RAM) to SQL Server. More memory means a larger buffer pool, which caches more pages in memory and reduces how often queries hit the disk. As Brent Ozar puts it, if you can’t tune queries enough, “consider adding more memory” so that the working set fits in cache (brentozar.com). Increasing RAM is often easier and cheaper than major storage upgrades, and it directly cuts down on PAGEIOLATCH waits by serving data from memory.
Finally, if queries are well-tuned and you have plenty of memory but still see PAGEIOLATCH waits, you might indeed have a slow disk subsystem. Then the solution might involve improving the storage – for example, moving to faster SSDs, spreading data files across more spindles, or tuning your storage configuration. This is usually a last resort after query and indexing fixes (brentozar.com), because hardware changes are costly.
In summary, high PAGEIOLATCH waits tell you “the server is waiting on reading from disk.” The quickest win is usually to reduce how much it needs to read (through indexing and query tweaks). Then, ensure your server has enough memory to cache hot data. Only after that should you worry about swapping out hardware or reconfiguring storage if necessary.
ASYNC_NETWORK_IO – Network/Application Waits
ASYNC_NETWORK_IO is a wait type that often confuses people at first. It doesn’t mean a problem with SQL Server processing the query, but rather that SQL Server has finished sending results and is waiting for the client application to consume them. In effect, SQL Server is saying, “I have data ready for you, but the network or the client is slow to accept it, so I’m waiting.” SQL Server will hold the results in an output buffer and pause until the client acknowledges it has read them (documentation.red-gate.com). This typically indicates that the bottleneck is on the client side or network – not inside the database engine.
Common causes of ASYNC_NETWORK_IO waits include:
- The application is pulling way more data than it can handle quickly, possibly looping through results row by row or doing heavy processing on each row, causing a delay.
- The result set is huge (millions of rows) and the network latency or bandwidth is a limiting factor (especially if the client is remote).
- The client application might be poorly written – for example, requesting data and then not reading it promptly, or waiting for user input mid-stream.
- There could be a true network issue (misconfigured NICs, congested network, etc.) causing slow data transfer documentation.red-gate.com documentation.red-gate.com.
How to investigate and reduce ASYNC_NETWORK_IO waits: First, identify which queries or apps are causing it. If you run a tool like sp_WhoIsActive or even a simple query on sys.dm_exec_requests filtering where status = 'suspended' AND wait_type = 'ASYNC_NETWORK_IO', you’ll see which session is waiting on network output. Often you’ll find it’s a reporting query or some procedure that returns a very large dataset. Note the application name or host – it could be an ETL service, a user running a huge report in SSMS, etc.
Once you know the culprit, you typically have to address it outside of SQL Server:
- Tune the query to return only necessary data. Does the user really need all 5 million rows at once? Maybe add filters or paging. If they truly need a large dataset, see if compression (e.g. using data compression or sending zipped files) is an option, or if the process can be optimized.
- Fix the application processing logic. Perhaps the app is selecting data and then filtering or aggregating on the client – push that work into SQL Server so less data is sent. Or maybe the app opens a result set and then does something inefficient (like waiting for user input or calling an external service per row). Such behaviour should be refactored to either consume all results quickly or request data in smaller chunks. In one example, an app was pulling lots of rows and doing client-side filtering – moving the filter into the SQL WHERE clause eliminated the ASYNC_NETWORK_IO wait completely.
- Check network throughput. Ensure the network link between the SQL Server and the application server is healthy. If there’s latency (maybe the app server is across a WAN link), consider locating the app closer to the database or using more efficient data transfer methods. Also, verify NIC settings (disable power saving, make sure full duplex, etc.) – though these are less common issues, they can contribute.
The key point is that ASYNC_NETWORK_IO is usually not a SQL Server engine problem. As Brent Ozar succinctly says, “There’s nothing you can do to performance tune the SQL Server here – you have to figure out why the app can’t get the data down faster” (brentozar.com). It’s telling you that SQL was ready with rows, and the ball is in the client’s court. By working with your application developers – maybe using profiling on the app side – you can often find the bottleneck (like a slow UI rendering all those rows, or a processing loop). After fixing or optimizing the application, these waits should drop. In summary, treat ASYNC_NETWORK_IO as a sign to optimize the data flow between SQL Server and the consumer: request only what is needed, and consume it as efficiently as possible.
SOS_SCHEDULER_YIELD – CPU Scheduling Waits
The wait type SOS_SCHEDULER_YIELD is a bit technical in name, but it essentially relates to CPU scheduling. SQL Server uses cooperative scheduling for threads: each thread gets a small quantum (around 4 milliseconds) of CPU time, and if it runs that long without voluntarily yielding (for example, if it’s a CPU-intensive task), it will yield the scheduler so other threads can run (documentation.red-gate.com). When a thread yields the CPU and goes back into the runnable queue (waiting for its next turn on the CPU), SQL Server records a SOS_SCHEDULER_YIELD wait for that time slice.
If you see SOS_SCHEDULER_YIELD as a significant wait, it often means CPU pressure – threads are having to yield and wait to get CPU time because the CPUs are busy. However, some amount of SOS_SCHEDULER_YIELD is normal even on a healthy system (threads will yield routinely after using their quantum). You should correlate this with signs of CPU bottlenecks: e.g. consistently high CPU utilization (near 100% on one or more cores) or a long runnable queue of threads. The wait stats DMV separates the concept of “signal wait time” which is the time a thread spent waiting in the runnable queue after being signaled (essentially CPU wait time). If you see a high signal wait component for many waits, it’s an indicator of CPU pressure. Redgate’s guidance notes that if the signal wait time per wait is more than a few milliseconds, it suggests CPU pressure (documentation.red-gate.com).
How to investigate and reduce SOS_SCHEDULER_YIELD waits (CPU bottlenecks): Start by confirming the CPU usage. Look at Windows Performance Monitor or SQL Server’s ring buffer info for CPU, or simply check sys.dm_os_schedulers: if runnable_task_count is often > 0 on many schedulers, it means tasks are waiting to get CPU (documentation.red-gate.com). A high runnable count plus SOS_SCHEDULER_YIELD waits strongly indicates the server is CPU-bound.
The solution is to reduce CPU load or increase CPU capacity. Tuning here means finding the queries that consume the most CPU and making them more efficient. Use tools like sp_BlitzCache @SortOrder = 'CPU' or Query Store to find queries with high total CPU time. Often it’s certain heavy queries or maybe many occurrences of a procedure that could be improved. Techniques include adding indexes to reduce the work needed, optimizing T-SQL logic, or caching results in the application if appropriate. Essentially, anything to do less work on the CPU will help.
Also consider whether parallelism is a factor: ironically, sometimes excessive parallelism can show up as CPU pressure – many parallel threads can saturate all CPU cores. We addressed CXPACKET earlier; applying those recommendations (raising cost threshold, reducing MAXDOP) can also indirectly cut down CPU overload and thus SOS_SCHEDULER_YIELD waits.
Check for other CPU-heavy issues: one rare cause is spinlock contention (a deep internals issue) which can manifest as SOS_SCHEDULER_YIELD. But that’s advanced – typically you’d see that in specific wait types or using specialized tools. The vast majority of cases are simply too much workload for the CPU. If you’ve tuned everything you can (queries are optimized, indexing is good) and CPU is still pegged, it might be time to add CPU resources – either faster processors or more cores. Adding CPUs (scaling up the server) is listed as a last resort to fix CPU pressure (documentation.red-gate.com), after confirming that the workload cannot be reduced further.
In summary, SOS_SCHEDULER_YIELD means threads are yielding CPU and waiting to get scheduled again – if it’s your top wait and performance is suffering, it’s a strong sign your CPU is the bottleneck. Focus on tuning CPU-intensive operations: optimize queries and indexes to make them cheaper, and if needed, consider increasing the server’s processing power. After addressing CPU issues, you should see these waits drop and overall response times improve.
Key SQL Server Configuration Best Practices
In addition to analysing waits and queries, it’s vital to ensure the SQL Server instance configuration is aligned with best practices. Misconfiguration can itself cause performance problems or exacerbate wait issues. Here we highlight a few configuration areas that significantly impact performance: parallelism settings (MAXDOP and Cost Threshold), “Optimize for Ad Hoc Workloads”, and indexing strategies. These are areas often overlooked, but proper tuning here can prevent bottlenecks in the first place.
MAXDOP and Parallelism Settings
As mentioned in the CXPACKET discussion, MAXDOP (Max Degree of Parallelism) controls how many CPU cores a single query can use in parallel, and the Cost Threshold for Parallelism controls the threshold at which a query is considered expensive enough to justify parallelism. The defaults (MAXDOP 0 = use all cores, Cost Threshold 5) are usually not ideal for a balanced system. Microsoft’s official recommendation is to limit MAXDOP based on number of cores: e.g. if you have more than 8 cores, cap MAXDOP at 8 (or even lower for OLTP), and on NUMA systems, not exceed half the cores per node (max 16) (support.microsoft.com). The reason is to keep parallel threads efficient and avoid overwhelming the server. Too many parallel threads can lead to diminishing returns and increased context switching.
To configure these, you can use sp_configure or the GUI. For example:
EXEC sp_configure 'cost threshold for parallelism', 50;
EXEC sp_configure 'max degree of parallelism', 8;
RECONFIGURE;
This would raise the threshold to 50 (meaning small queries won’t go parallel unless their estimated cost is above 50) and cap parallelism to 8 cores for any single query. Adjust these numbers based on your workload – some environments might even use a higher threshold (e.g. 50-100) to avoid parallelism on anything but the largest reports. The goal is to strike a balance: allow parallelism for genuinely heavy queries, but prevent every little query from spawning multiple threads (which can actually hurt latency and use more CPU overall). Monitoring wait stats and CPU usage can guide you – if after changes you still see CXPACKET high and CPU low, maybe threshold could be higher; if CPU is high and CXPACKET still high, maybe the queries need tuning or MAXDOP could be lowered further.
Another related setting is Affinity Mask (binding CPUs) but typically you leave that default unless specific needs. The main two to get right are MAXDOP and Cost Threshold. Proper parallelism settings ensure the query processor behaves optimally and can prevent CXPACKET waits from dominating.
Optimising for Ad Hoc Workloads
SQL Server has a configuration option called “Optimize for Ad Hoc Workloads” (note: spelled with a “z” in the option name, but we’ll use Australian spelling here). This setting is used to improve the efficiency of the plan cache when you have lots of single-use or ad-hoc queries. By default, every time a new query is executed, SQL Server will cache its execution plan in memory. If you have many one-off queries (common in some applications or ORMs), the plan cache can get bloated with plans that will never be reused, wasting memory.
When Optimize for Ad Hoc Workloads is enabled (sp_configure 'optimize for ad hoc workloads', 1), the first time SQL Server sees a query, it doesn’t store the full compiled plan – it stores a small plan stub instead (learn.microsoft.com). This stub is much smaller and basically just notes that the query was seen. If the query is executed again, then SQL Server will cache the full plan. This way, single-use queries don’t fill up the cache with large plan structures; only queries that run frequently get to occupy space with a full plan. This can relieve memory pressure by not allowing the plan cache to become filled with thousands of unused plans (learn.microsoft.com).
For example, imagine a web app where each search generates a slightly different SQL (maybe because of literals instead of parameters). You could end up with thousands of cached plans, each used only once. With this option on, those would just be stubs until a second execution happens. This typically improves the buffer pool memory available for data pages, etc., thereby indirectly improving performance (less memory wasted means less I/O, etc.). Do note one trade-off: if you’re troubleshooting, you might not immediately see the full plan for a query that ran only once – because only the stub was cached. But you can always capture the plan on first execution manually if needed.
Enabling this option is generally considered safe and beneficial for most OLTP systems with lots of dynamic SQL or ORM-generated queries. It’s a quick configuration change that often yields a minor performance gain by trimming plan cache fat. Microsoft documentation states that this option can help “relieve memory pressure” by not caching single-use plans (learn.microsoft.com). Many SQL Server experts recommend turning this on as a best practice for busy workloads that fit the profile of lots of ad hoc queries. (A contrary view by some is that it could complicate plan analysis, but the performance benefit usually outweighs that.) In summary, consider enabling Optimize for Ad Hoc Workloads to make your plan cache usage more efficient – it’s a small tweak that can free up memory for better uses.
Proper Indexing Strategies
It’s often said that indexes are the key to database performance. Indeed, “poorly designed indexes and a lack of indexes are primary sources of database application bottlenecks” (learn.microsoft.com). Proper indexing ensures that queries can find the data they need without scanning entire tables, which not only speeds up those queries but also reduces resource usage (CPU, I/O) for the server as a whole. Good indexing directly combats waits like PAGEIOLATCH (by cutting down I/O) and even CXPACKET (since smaller data sets may not need parallelism). It also reduces lock contention because queries finish faster and touch fewer rows.
Here are some indexing best practices and tips:
- Create indexes to support your most frequent and expensive queries. Focus on the predicates (the columns in JOIN, WHERE, ORDER BY) of those queries. For example, if a query frequently filters by
CustomerIDand sorts byOrderDate, an index on(CustomerID, OrderDate)could be idealstackoverflow.com. This way, SQL Server can seek directly to relevant rows and even satisfy the sort from the index. - Avoid over-indexing. While missing an index can be bad, having too many indexes can also hurt performance on writes (every INSERT/UPDATE/DELETE has to maintain those indexes) and even cause the optimizer to choose suboptimal indexes. Strike a balance – an index for every column combination is not feasible. Use tools like
sp_BlitzIndexwhich warns about “Aggressive indexes” (too many indexes on a table) and suggests consolidating if possible (brentozar.com | brentozar.com). - Keep indexes narrow (few columns) and selective. A wide index (many columns) takes more space and maintenance. Aim for indexes that efficiently filter data. Nonclustered indexes with 5 or fewer key columns (plus includes) are a general rule of thumb (brentozar.com). Highly selective indexes (where the indexed column has many distinct values relative to rows) are most effective.
- Monitor missing index DMVs and usage stats. SQL Server’s missing index DMVs (
sys.dm_db_missing_index_*) can suggest indexes that might improve queries (with an impact estimate). Use those suggestions with caution – evaluate if they truly make sense. Similarly,sys.dm_db_index_usage_statscan tell you which indexes are rarely used (and could be candidates to drop). Unused indexes add overhead with no benefit (brentozar.com). - Maintain your indexes. Fragmentation can slow down range scans, and outdated statistics can mislead the query optimizer. Use a regular maintenance routine to rebuild or reorganize indexes when needed (especially on OLTP systems where fragmentation can occur) and update statistics. That said, don’t obsess over fragmentation for small tables or in-memory scenarios – focus on the big tables that matter.
By implementing a sound indexing strategy, you address performance at the root. Indexes help queries run faster, which means less CPU time, less I/O, fewer locks held – in effect, reducing many types of waits. For example, after adding a needed index, you might observe that a query which used to cause 5 seconds of PAGEIOLATCH waits now runs in 0.1 seconds with almost no discernible waits. Proper indexing is one of the best preventative medicines against performance problems in SQL Server.
Using Execution Plans to Diagnose Slow Queries
While wait stats tell you what resource a query is waiting on, the execution plan of a query reveals how the query was executed. Reading execution plans is a crucial skill for performance tuning, as it lets you pinpoint inefficiencies in query execution. SQL Server offers both estimated and actual execution plans (the actual plan includes runtime statistics like actual row counts and can even include wait stats per operator in recent versions).
To get an actual execution plan, you can use SQL Server Management Studio (SSMS): enable “Include Actual Execution Plan” (Ctrl+M in SSMS) and then run your query. The plan will appear in a separate tab showing the operators (index seeks, scans, joins, sorts, etc.) with various properties. Key things to look for in an execution plan include:
- Scans vs Seeks: If you see a table scan or index scan on a large table, that’s often a red flag for performance. It means no suitable index was used for that part of the query, so SQL Server had to read a lot of rows. This often correlates with high I/O (PAGEIOLATCH waits). Consider if an index could turn that scan into a seek.
- Expensive operations: The plan shows cost percentages (for estimated cost) – operators with high cost are worth focusing on. For example, a sort or hash match that takes 80% of the cost suggests that operation is a bottleneck. Maybe an index to pre-sort the data or a rewrite of the query could eliminate the need for that sort or join method.
- Key Lookups: These appear as a Bookmark Lookup or Key Lookup in plans. A key lookup means for each row from a nonclustered index, SQL had to go fetch additional columns from the clustered index. A few lookups are fine, but if you see tens of thousands, it can be a performance issue. The solution is often to cover the query by adding the needed columns as INCLUDE columns in the nonclustered index to eliminate the lookups.
- Parallelism operators: If the plan has the Parallelism operators (Distribute Streams, Gather Streams), it means the query ran in parallel. You might notice multiple branches of the plan with the same operations (one per thread). If the query is small but went parallel, it might indicate your Cost Threshold is too low. If the query is large, parallelism was likely beneficial, but check for skew – one sign is if one thread did much more work than others (not directly obvious in graphical plan, but actual row counts might differ per thread in the XML or in operator properties in SSMS’s plan viewer).
- Warnings: SSMS highlights certain warnings with yellow triangles on the plan. For example, missing statistics, or an operator that had to spill to tempdb (sort/hash spill) due to insufficient memory. If you see spills, that can degrade performance; increasing memory (or workgroup memory settings) or rewriting the query to require less memory (e.g. break a huge sort into smaller pieces) could help. A missing index suggestion might appear as a green text in the plan (in SSMS) – that can be a clue for improvement, though again evaluate it carefully.
It’s also useful to compare estimated vs actual rows for each operator (SSMS shows these if you hover over an operator in the actual plan). If you see a big discrepancy – e.g. the estimate was 10 rows but actually 10,000 were returned – it means the optimizer’s cardinality estimation was off. That can lead to suboptimal plan choices. Updating statistics or sometimes rewriting the query (or using a hint, in some cases) can help the optimizer get a better estimate and choose a better plan. Parameter sniffing issues often manifest as such discrepancies.
Microsoft’s documentation and experts advise checking execution plans for inefficiencies like those above: “Look for missing indexes, key lookups, and scans that might indicate performance issues” (learn.microsoft.com). Use the plan in conjunction with wait stats: for example, if a query’s waits are mostly PAGEIOLATCH, you’ll likely find scans in the plan. If waits are CXPACKET, you’ll see a parallel plan. If waits are SOS_SCHEDULER_YIELD (CPU), you might see a very CPU-heavy plan (lots of computations or loops).
In recent SQL Server versions, the actual execution plan even records cumulative wait stats per operator (you can see this by right-clicking the plan, Show Properties, and looking at WaitStats for each operator) (learn.microsoft.com). This can show, for example, that a particular index seek incurred most of the wait (perhaps waiting on a lock or I/O on that index). It’s a more advanced technique, but worth mentioning since it ties execution plans and wait analysis together directly.
To sum up, reading execution plans is how you identify why a query is slow: it could be scanning too much data, using a slow join method, missing an index, etc. Once you spot the issue in the plan, you can target your fix – create an index, rewrite the query, update stats, or adjust server settings. Always capture the plan for troublesome queries and use it alongside wait stats: wait stats tell you what resource was problematic, and the execution plan tells you where in the query that resource was used.
Conclusion
Assessing SQL Server performance bottlenecks is much easier when you know where to look. By leveraging wait statistics, you can quickly identify whether the primary constraint is CPU, I/O, network, or something else. In this guide, we discussed using DMVs and tools to gather that information, and we dove into interpreting common waits like CXPACKET (parallelism), PAGEIOLATCH (disk I/O), ASYNC_NETWORK_IO (network/app), and SOS_SCHEDULER_YIELD (CPU). We also highlighted the importance of core configuration settings (like MAXDOP and Cost Threshold for parallelism, enabling optimize for ad hoc workloads, and having a solid indexing strategy) in preventing and alleviating bottlenecks. Finally, we saw how reading execution plans helps correlate those wait symptoms with the actual query operations that cause them, leading us to concrete solutions (indexes, query tweaks, etc.).
By following these practices and using the scripts and tools mentioned (e.g. Brent Ozar’s First Responder Kit for a quick health check, or Redgate SQL Monitor for ongoing insights), you can methodically troubleshoot and resolve SQL Server performance issues. Remember that performance tuning is an iterative process – identify the top bottleneck, address it, then move on to the next. Over time, you’ll build a system that runs smoothly with minimal waits. And when new performance issues arise, you now have a toolkit to diagnose them quickly and keep your SQL Server instance running optimally.
References:
- Microsoft Learn – sys.dm_os_wait_stats (Transact-SQL) learn.microsoft.com learn.microsoft.com
- Microsoft Support – Server Configuration: max degree of parallelism (KB 2806535) support.microsoft.com
- Microsoft Learn – Optimize for ad hoc workloads (Server Configuration Option)learn.microsoft.com
- Microsoft Learn – SQL Server Index Design Guidelearn.microsoft.com
- Brent Ozar – Using Wait Stats to Find Why SQL Server is Slowbrentozar.com brentozar.com brentozar.combrentozar.com
- Brent Ozar – sp_BlitzFirst and sp_BlitzCache usage examplesbrentozar.combrentozar.com
- Redgate SQL Monitor Documentation – Common Wait Types (explanations of CXPACKET, ASYNC_NETWORK_IO, etc.)documentation.red-gate.com documentation.red-gate.com documentation.red-gate.com documentation.red-gate.com documentation.red-gate.com documentation.red-gate.com
- Redgate Hub – Introduction to Analyzing Waits using SQL Monitor documentation.red-gate.com documentation.red-gate.com
- Microsoft Q&A – Identifying and solving slow-running queries (execution plan tips) learn.microsoft.com